

Debt levels and composition

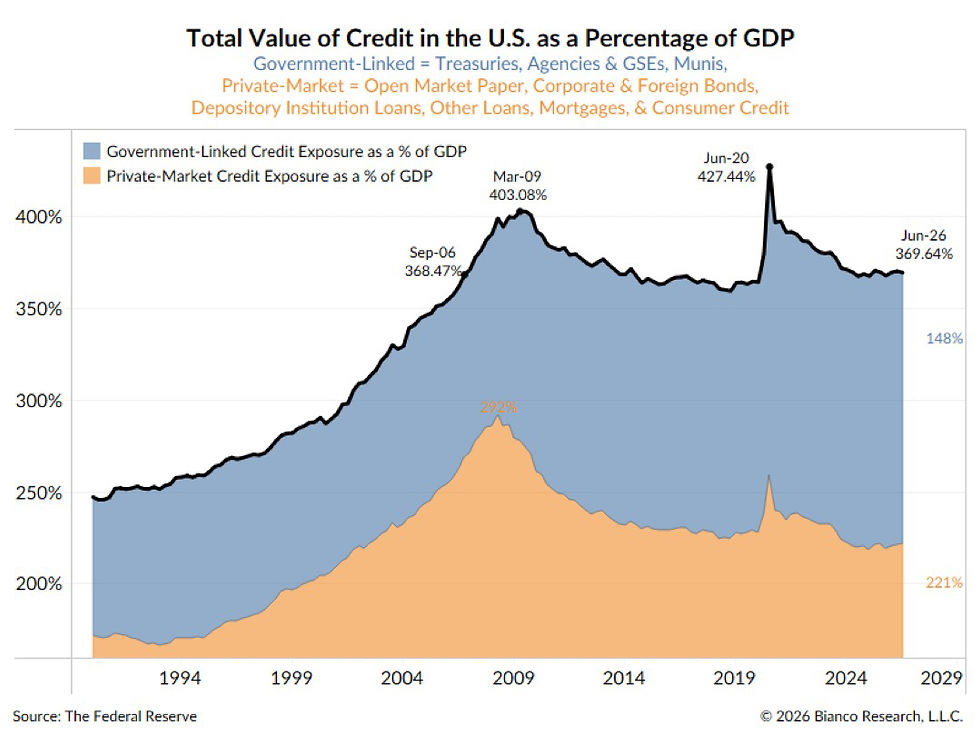
Total credit is now roughly where it was in September 2006, well below the 2009 peak of 403% and the 2020 spike of 427%. On the surface, that looks like deleveraging in relative basis, as we will discuss below, but in absolute terms, both figures have increased, and remember that we are comparing debt levels with nominal GDP, which includes inflation, particularly the high singles digits we experienced after the pandemic.
What’s interesting is not the level, it’s the composition, which has flipped:
📉 Private-market credit has fallen from ~292% of GDP in 2009 to 221%
📈 Government-linked credit now stands at 148%, a much larger share of the total
What that means:
Fed hikes: The private sector is less levered, so higher rates bite less than in past cycles. The pressure shifts to the Treasury, where interest costs compound as debt rolls over at higher rates.
Yield curve: Persistent Treasury supply puts upward pressure on term premiums. That favors a steeper curve, driven by the long end rather than by Fed easing.
Liquidity: Heavy issuance competes for the same pool of capital. Treasury auctions, the Fed's balance sheet, and bank reserves matter more to market liquidity than they used to.
Growth: When the public sector carries more of the credit load, private credit creation, the traditional engine of expansion, has less room. Growth leans more on fiscal impulse, which is harder to sustain.
The risk is no longer a private-sector credit bust like 2008. It's a slow squeeze: higher funding costs for the sovereign, structurally higher long yields, and tighter liquidity.
Want to know more? You can register for free at Fund@mental.
#iamfundamental #soyfundamental #wealthmanagement #familyoffice #financialadvisor #financialplanning #policymistake #ratecut #stagflation


Comments