

Longest drawdown
- Gustavo A Cano, CFA, FRM

- Jan 2
- 1 min read
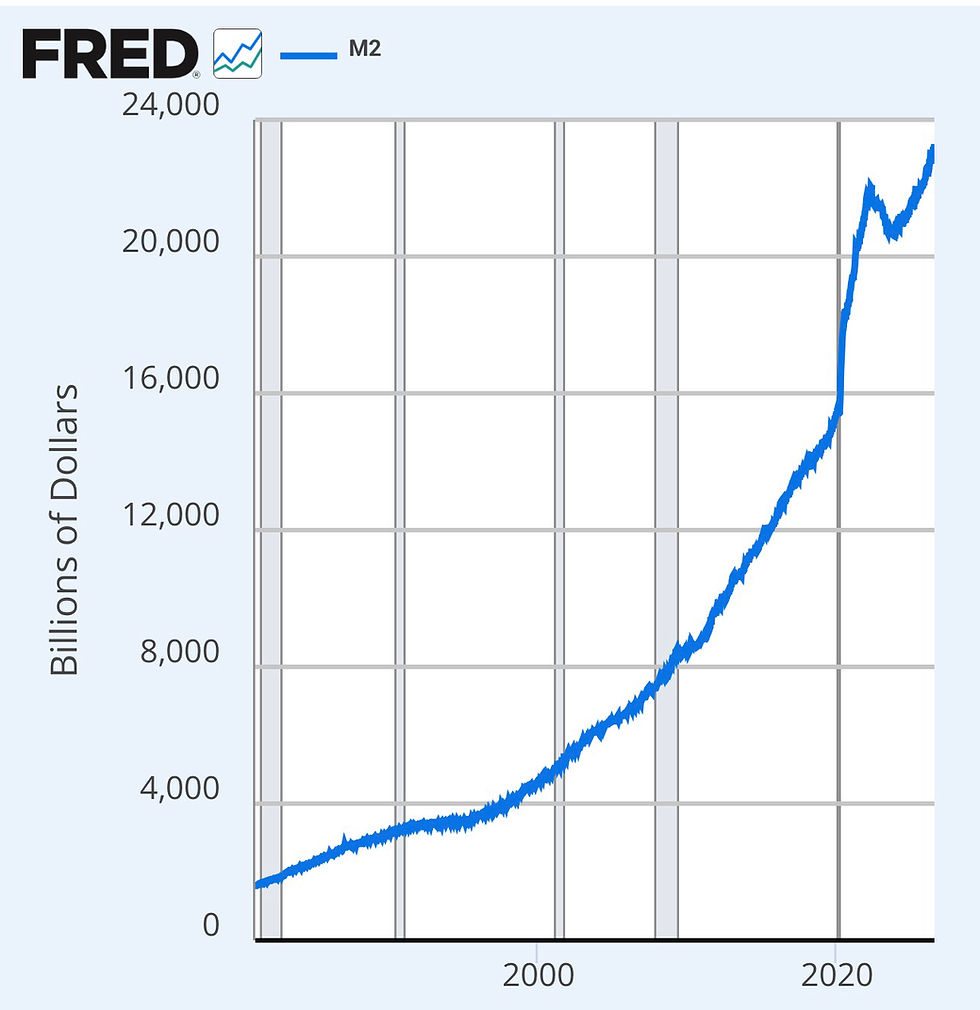
The U.S. bond market, measured by the U.S. Aggregate Index has been suffering for 65 months. That is by far, the longest in history, and it’s not clear if 2026 will end the drawdown. Since the 80’s, when Paul Volcker raised rates to break the back of inflation, bonds have been on a bull market fueled by a downtrend in interest rates rates, which ended with zero interest rates, and since 2021 has started to reverse the trend, partly due to inflation fears, and partly due to the massive budget deficit the U.S. has been running for a few years now. Nothing seems to point to a good year for long rates, as dovish monetary policy should spark additional inflation, but when the market is mostly on one side of the trade, it’s the opposite that happens. Is 2026 the year she the Fed will end the drawdown through QE, or will investors fin a reason to buy long term rates?
Want to know more? You can find all our posts at https://www.myfundamental.net/insights
#iamfundamental #soyfundamental #wealthmanagement #familyoffice #financialadvisor #financialplanning #policymistake #ratecut #stagflation



Comments