
Mid term year
- Gustavo A Cano, CFA, FRM

- Feb 22
- 2 min read
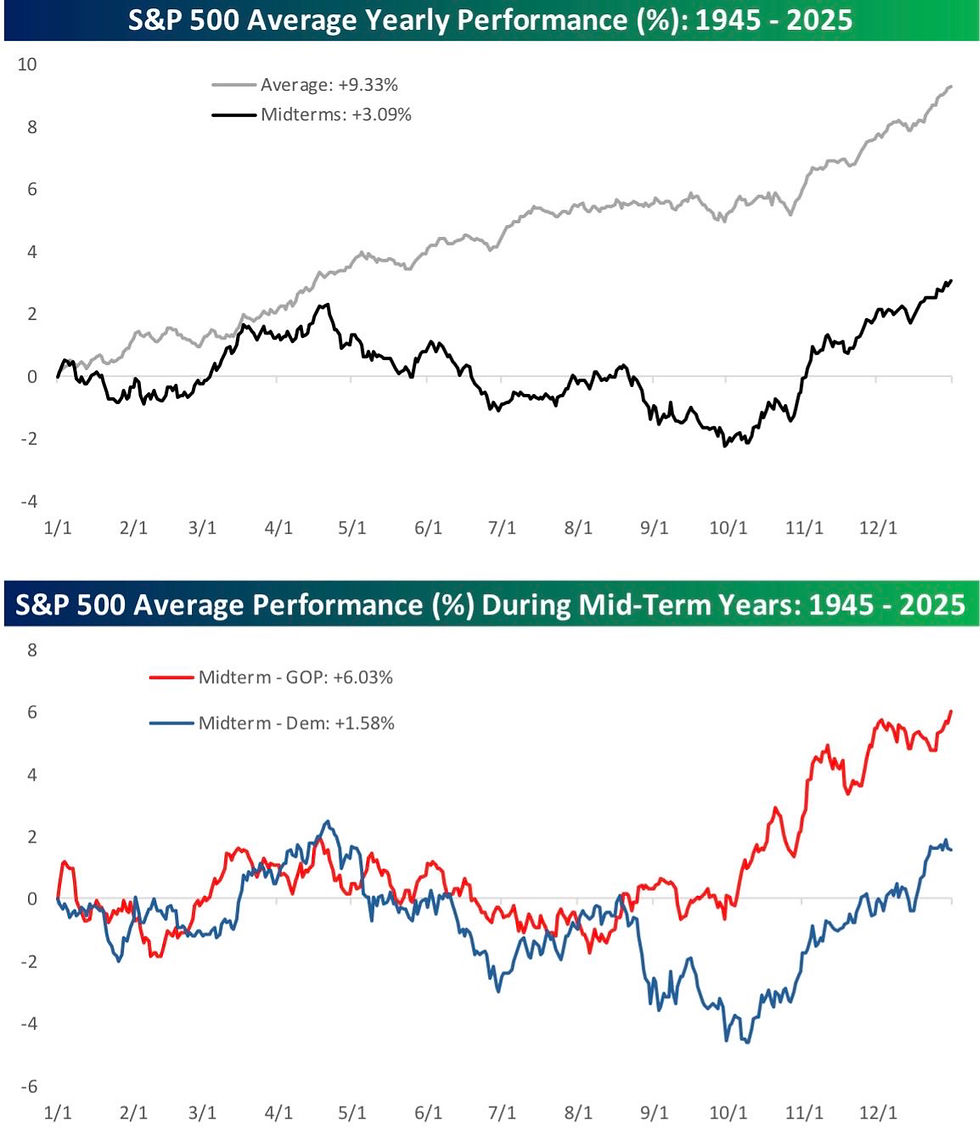
2026 is a Mid term election year. The same way that in general election years, the market follows a pattern, in years like this one, it tends to follow a similar path than prior mid term years. You can see that in the chart below. It’s more volatile than the average year; tends to peak in April and bottoms around October, right before Election Day on November. This is, of course, an average of all years on record after 1945, and it may be different this time (famous words), but it’s important to take it into account, because there is indeed a seasonal pattern. Remember that in March we have an FOMC where as of today, no rate cuts are expected. The U.S. has a weakening labor market, that is under attack by AI, but it’s also suported by tougher immigration policies that reduce the active population. It has too much debt and a growing deficit, and has not reached a trade agreement with China. On the domestic front, ICE detention policies and house affordability continues to be troubling for the administration. On the international side, a potential attack to Iran and its repercussions in the Middle East, are the main concerns. Corporate earnings continue to be solid, shadowed by credit concerns, high valuations and concentration. The eyes of the reader will go to the right side of the bottom chart, where the red line (mid term average with a republican in th White House) goes up in the fourth quarter, but we still need to cover the middle ground, assuming the pattern holds.
Want to know more? You can register for free at Fund@mental.
#iamfundamental #soyfundamental #wealthmanagement #familyoffice #financialadvisor #financialplanning #policymistake #ratecut #stagflation


Comments